Kelvin Waves and El Niño
The following was part of my SoCal report 9/20/26 to address media hype concerning a Kelvin Wave that was heading to SoCal, while showing the facts of what was actually happening.
9/20/26 - El Niño and the Kelvin Wave: While the name sounds ominous, much of the media has misconstrued Kelvin Waves as giant surface swells or destructive tsunami-like waves. But that's not the case. Instead, oceanic Kelvin Waves are a common, foundational ingredient of every El Niño. Kelvin Waves don't ride at the surface of the ocean; instead, they are subsurface masses of warm water that drive El Niño's climate engine. Without Kelvin Waves we wouldn't have El Niño. But there are things to be aware of this year, so I'd like to separate the facts from media hype.
Westerly Wind Bursts (WWBs) are the trigger for Kelvin Waves and for the most part, El Niño itself. As you may know, under normal conditions, strong trade winds blow east to west, piling up warm water in the Western Pacific. But when those trade winds weaken, then that warm water moves to the Eastern Pacific, creating an El Niño. But if those winds don't just weaken but actually reverse, then we call that a Westerly Wind Burst, which drives more warm water at a faster rate to the Eastern Pacific, resulting in more warmth in the El Niño zones extending off Peru. That's a Kelvin Wave.
Once a Kelvin Wave reaches South America, the warm water essentially splits with a significant portion traveling north, morphing into what's known as a "Coastal Kelvin Wave". But once again, it's not a breaking wave — it's a mass of warm water. And this is where things get interesting.
Kelvin Waves are part of all El Niños and they played a role in the 1997 El Niño when Kelvin Waves started in December 1996 and lasted through mid 1997. The 2015 El Niño had Kelvin Waves too, which started in the spring of that year. For our current El Niño, Kelvin Waves started as early as January 2026 and we had strong Kelvin Waves in the spring. In June, after a strong Kelvin Wave made it to South America, it split and formed a Coastal Kelvin Wave that reached SoCal. Of all the Kelvin Waves so far this year, a fourth one occurred this summer, which is the one that the media has homed in on. Yet it, and the Kelvin Waves before it, are leading up to the same result.
Kelvin Waves bring warm water. Since warm water expands, sea levels rise, and that's what happened from this year's developing El Niño (known as thermal expansion). This year's event is similar in regards to past El Niños in that warm water has increased sea levels near SoCal. This happens with each El Niño. In 1997, sea levels rose 8-12" above normal. In 2015 they rose 6-10". And right now, sea levels are about 6-12" above normal. This year though, a compounding factor is the lack of sand at many beaches that were heavily eroded from this summer's swells — Marie in particular, adding a wrench in the works.
When Marie slammed SoCal, a tidal swing was underway with high tides in the 6' range. Add another 12" to that from thermal expansion and you essentially have a 7' high tide. Such an extreme high tide, combined with exceptionally heavy surf from Marie, added to the beach erosion. Even without the extra foot in sea level rise, the combo of very high tides and Marie's powerful surf would no doubt have caused some erosion. Adding the extra foot (or so) from thermal expansion worsened the erosion. Either way, we now have something to contend with, and prepare for.
Having less sand barrier now from this summer's beach erosion, combined with higher sea levels from warmer waters brought on by El Niño and the Kelvin Waves driving it, there is a higher risk of coastal flooding and further erosion during upcoming swells — not just for the short term like from Polo, but more so during the winter from El Niño-influenced NW swells. But the Kelvin Waves are just one aspect of this year's El Niño.
This year's El Niño is on track to reach a record "signal" strength, but we need to put that into perspective (image from NOAA CPC):
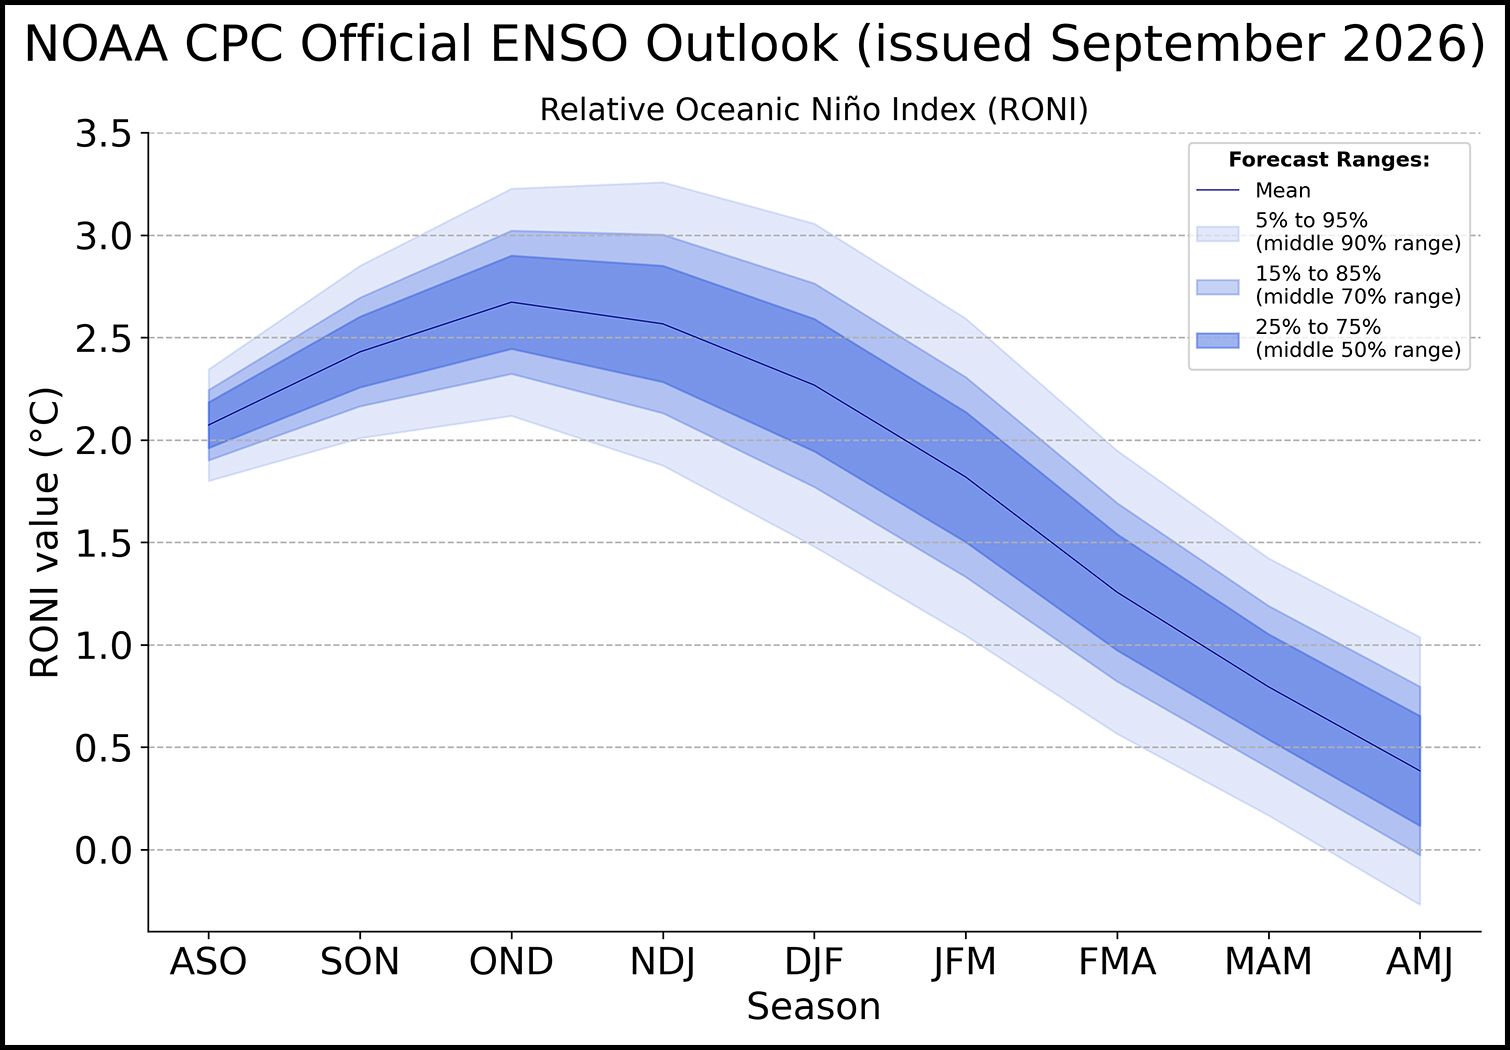
Over the next couple months (OND for October, November, December), this year's El Niño should have a strength of about 2.6°C. By comparison, the El Niño of 2015-16 measured 2.6°C, and the 1997-98 Niño was 2.4°C. But that's measuring warm water in the El Niño zones. If we take a look at the bigger picture, water temperatures are warmer across the entire Pacific, and our planet as well.
For instance, here's what water temps looked like leading up to the 1997-98 El Niño (model from NOAA Coral Reef Watch):
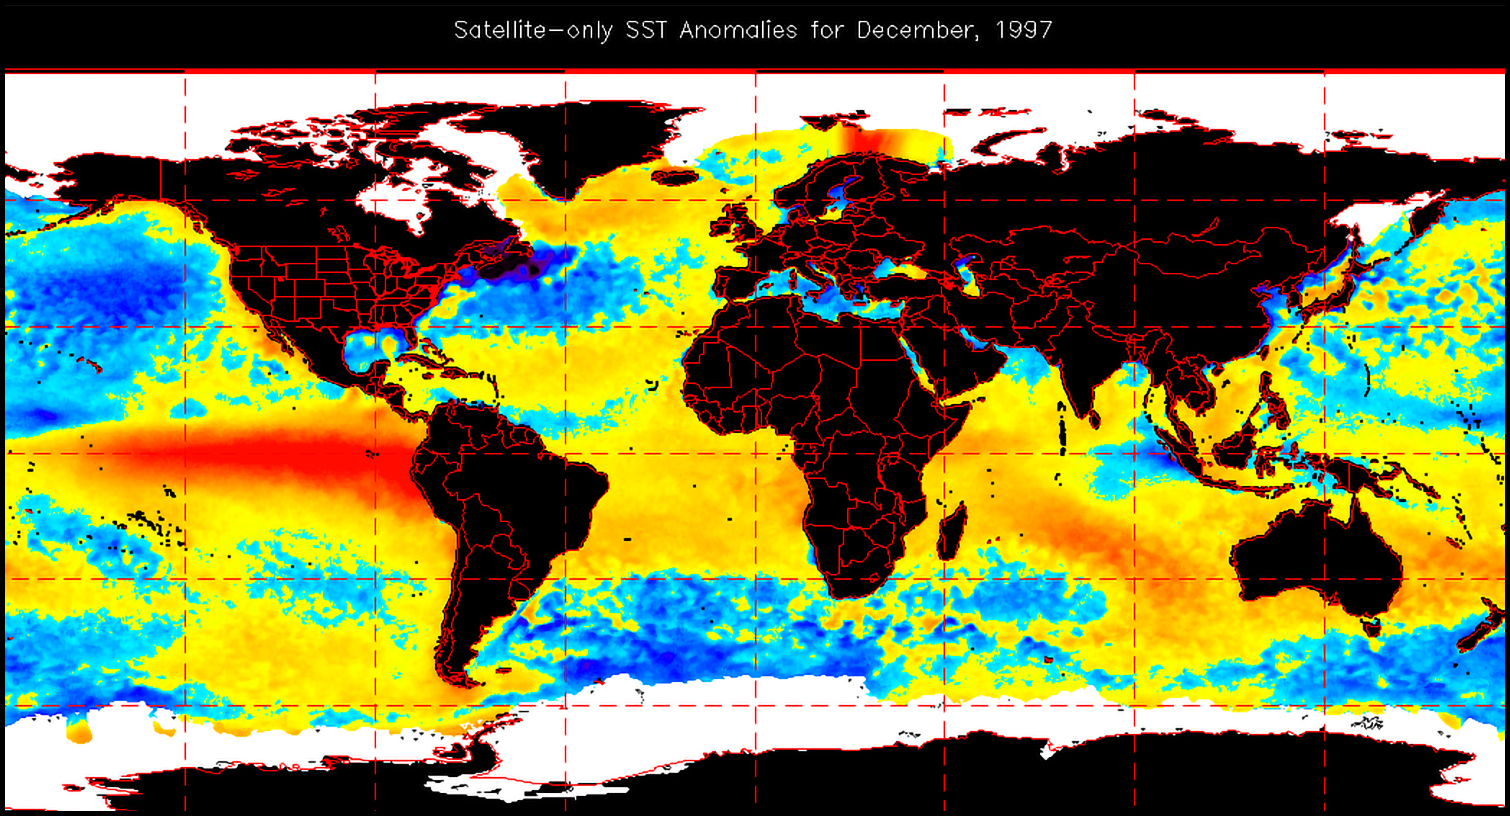
In that older model the Pacific wraps from the left to right side of the image, different from more recent models I'll show for comparison. In any case, we can see the telltale red tongue of warm water extending off Peru (left side of the image), signaling a strong El Niño. But notice all of the blue water in the North Pacific, which represents below normal water temps in 1997. This is much different when we look at the water temps leading up to the "Godzilla" El Niño of 2015-16 (model from NOAA Coral Reef Watch):
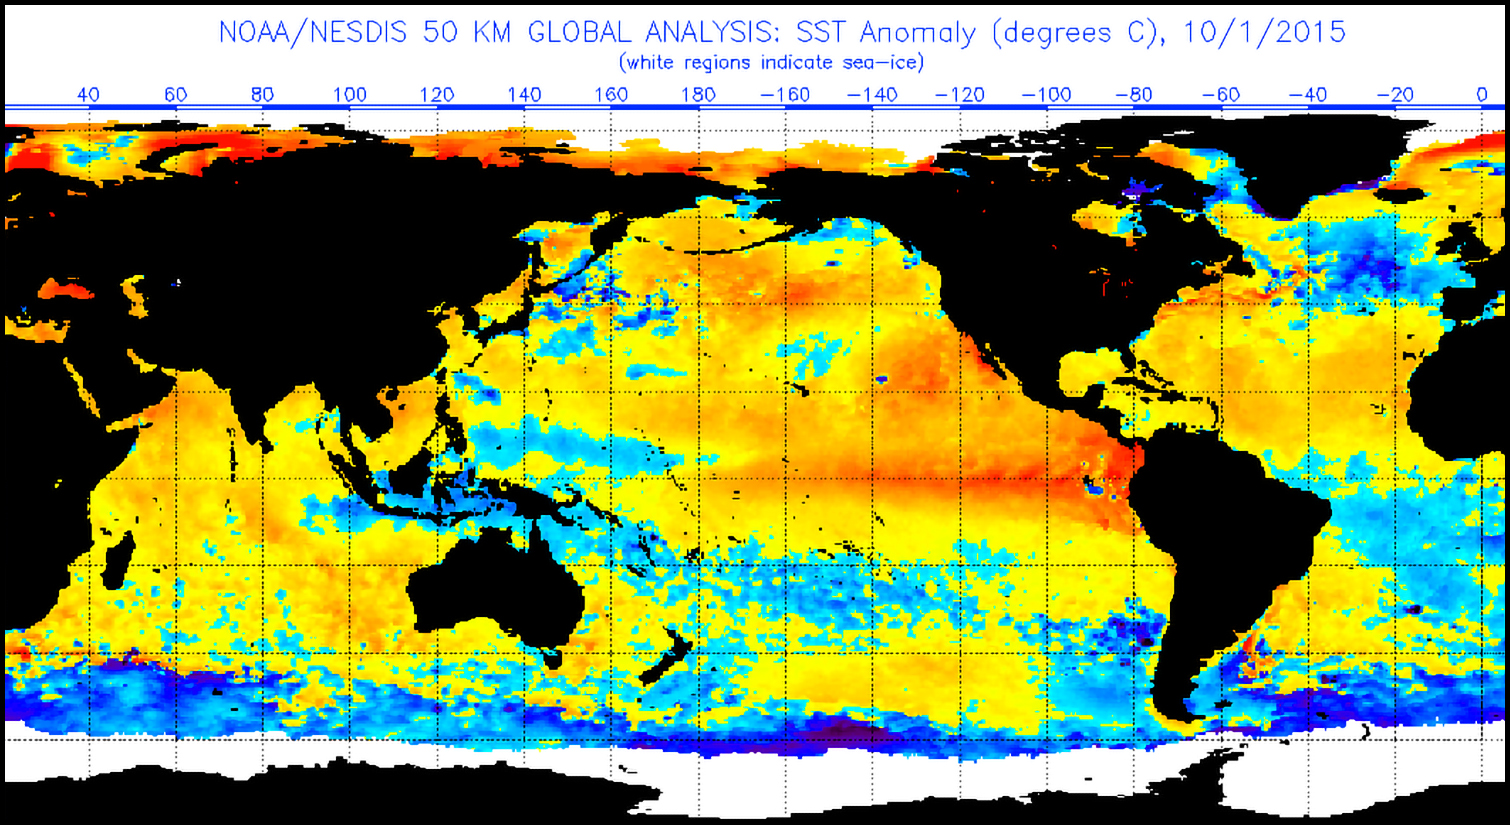
Sure, we see the telltale tongue of warm water extending off Peru (center of this image), but notice what's absent: blue, colder water elsewhere in the Pacific. In fact, the North Pacific was dominated by marine heat waves in 2015 (coined "The Blob"). Overall though, with the North Pacific so warm in 2015 there was less difference between warmth in the El Niño zones and the rest of the North Pacific. Differences in temperature determine weather, which is likely why 1997-98 saw over 30" of rain in parts of SoCal while 2015-16 saw just 10". El Niño warming was stronger in 2015, but so was the rest of the North Pacific, resulting in a different weather pattern compared to 1997-98.
If we now take a look at the present state of El Niño, we see something similar to 2015, not 1997 (model from NOAA Coral Reef Watch):
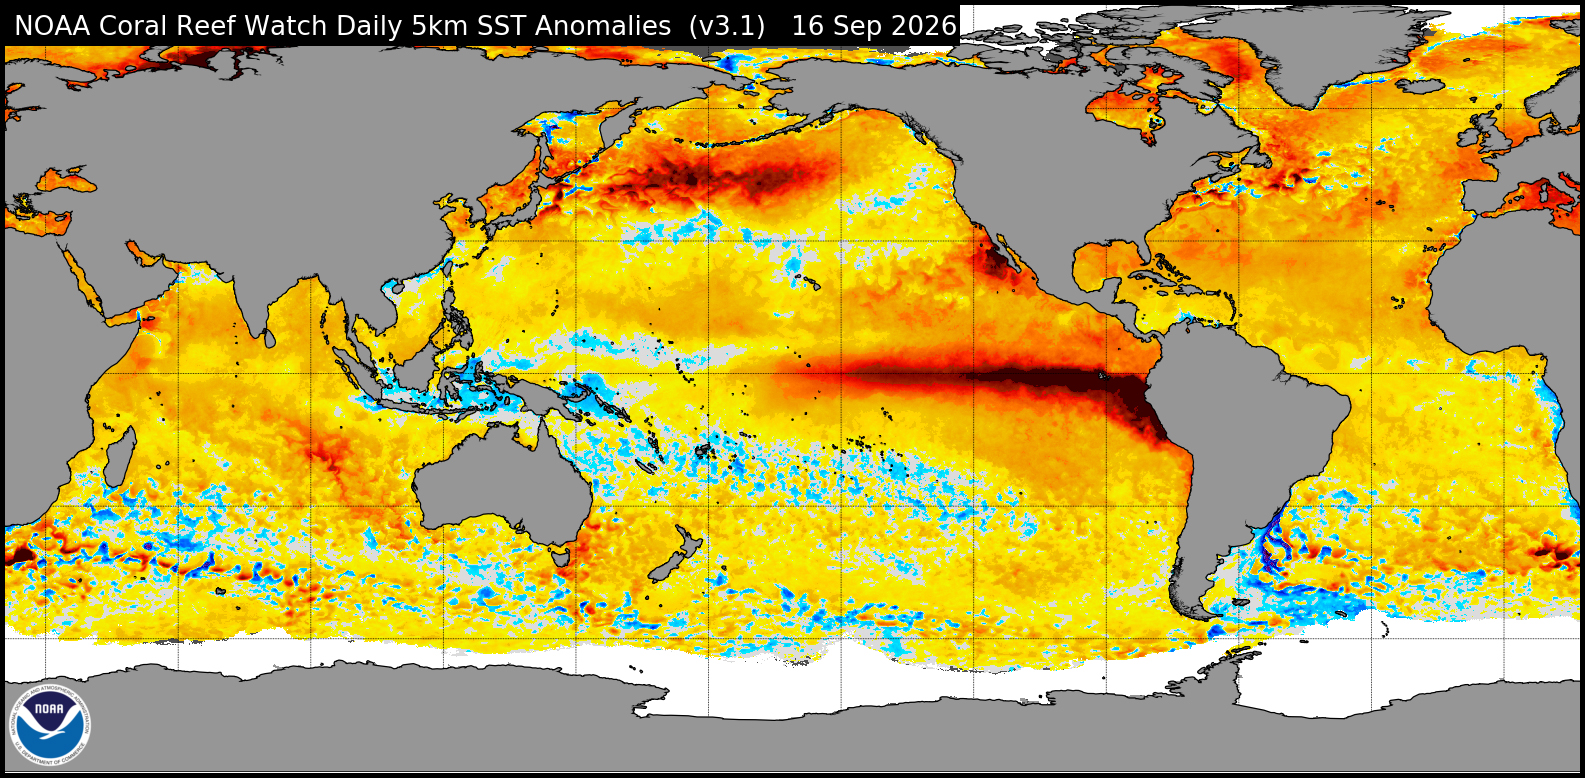
El Niño warmth is evident off Peru. But waters are exceptionally warm in the North Pacific too. If we put a measurement on this difference between the El Niño zones compared to the rest of the North Pacific, the 1997-98 event was about Δ4°C. But today the difference is about Δ2°C.
Although media coverage of El Niño's Kelvin Waves has been largely misleading, it distracts from the fact that we need to prepare for the worst. When headlines become hyperbole, they're sadly seen as crying wolf, as though the whole thing should be discounted. But it shouldn't. Instead, the 2.6°C forecast for this year's El Niño is a warning to make immediate preparations. No one can say with a high degree of certainty if this winter will be similar to 1997-98, 2015-16, or other El Niño seasons. There is a high "likelihood" of above average rainfall and powerful winter swells. And even though that is "probability", it warrants preparation.
Kelvin Waves and El Niño as a whole are still in the nascent stages of science and our overall understanding. As I mention more than once in Wave by Wave, we're just a few specs of carbon on a water-filled rock that's spinning over 1,000 mph while racing around a modest star at a blinding 67,000 mph within an insignificant solar system housing a handful of planets traveling through a galaxy at 514,000 mph that's whipping through a universe at 1.3 million mph. You, I, and everything on Earth will never be in the exact same place in space ever again — even from second to second we enter new cosmic territory as we hurtle through the universe. And as we barrel through the cosmos, our planet spins and rotates through numerous cycles. We can use science to work within these cycles to gauge what might occur as these same cycles influence Earth's climate and give us insight — but not assuredness.
Our world of waves and weather is a constantly moving target. The short term — let alone the long term — forecast needs much more monitoring. But as long as I have your support then I can continue to keep an eye on the Pacific to keep you posted. Please remember this report is funded by reader donations and your help is needed to keep it alive (see why here).